SportVU Part 1: Loading SportVU and EDA
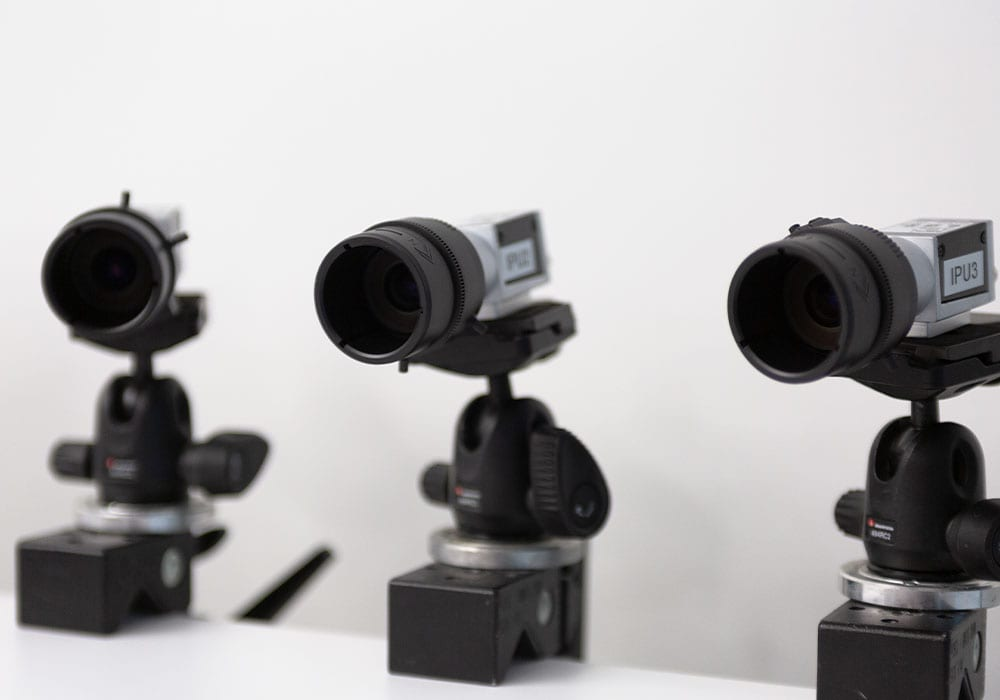
SportVU is a camera tracking technology that the NBA used from 2013-2014 to 2016-2017. It was originally created in 2005 in Israel by missile tracking scientists. No wonder their system works so well. SportVU works through a system of six-cameras which take 25 photos a second (one photo every .04 seconds).

The NBA had been posting the tracking data publically, but then removed it. Thankfully, some people have it hosted on their GitHub repositories. There are repositories that host more games, however we’ll only need one for now so this repository by Neil Johnson will work perfectly.
Start by downloading this and importing pandas and numpy into your project. I named the file game.json and loaded it into memory using read_json.
import pandas as pd
import numpy as np

df = pd.read_json('../data/game.json')
Right now, the formatting is off. If you display this DataFrame, it’ll show three columns: gameid, gamedate, and events. It’s only one game, so we just want the event column. Events are… events. They describe some play in the game. These can be pretty long–around 10 seconds– and often don’t fit neatly into a single play.
df['events']
0      {'eventId': '1', 'visitor': {'name': 'Detroit ...
1      {'eventId': '2', 'visitor': {'name': 'Detroit ...
2      {'eventId': '3', 'visitor': {'name': 'Detroit ...
3      {'eventId': '4', 'visitor': {'name': 'Detroit ...
4      {'eventId': '5', 'visitor': {'name': 'Detroit ...
                             ...
467    {'eventId': '541', 'visitor': {'name': 'Detroi...
468    {'eventId': '543', 'visitor': {'name': 'Detroi...
469    {'eventId': '545', 'visitor': {'name': 'Detroi...
470    {'eventId': '546', 'visitor': {'name': 'Detroi...
471    {'eventId': '548', 'visitor': {'name': 'Detroi...
If you haven’t already noticed, this data is really messy. The approach I’ll be taking is to drill into a single event and later expand to an entire game.
Let’s look at the first event.
first_event = df['events'][0]
It is a dictionary with four elements. The first is the eventId, the second and third hold information about the home team and visitor team respectively, and the fourth is the tracking data that we’re really interested in.
The tracking data is inside an array known as ‘moments’. Moments describe a .04 second snapshot. In this event there are 150 moments which means the total time is 6 seconds.
first_moment = first_event['moments'][0]
[1,
 1445991110020,
 720.0,
 24.0,
 None,
 [[-1, -1, 47.25031, 26.14806, 6.76567],
  [1610612737, 2594, 45.70423, 15.5787, 0.0],
  [1610612737, 200794, 56.87016, 22.95879, 0.0],
  [1610612737, 201143, 47.26914, 24.47616, 0.0],
  [1610612737, 201952, 28.26728, 23.734, 0.0],
  [1610612737, 203145, 40.59368, 31.74141, 0.0],
  [1610612765, 101141, 56.27694, 25.5146, 0.0],
  [1610612765, 202704, 73.64107, 25.48774, 0.0],
  [1610612765, 202694, 48.64923, 35.26915, 0.0],
  [1610612765, 203484, 48.46352, 14.55436, 0.0],
  [1610612765, 203083, 47.51449, 24.36448, 0.0]]]
There’s a lot to look at here. Here’s what each element means.
- Quarter
- Time in milliseconds – you can use this site to find the actual date and time.
- Seconds left in the quarter
- Seconds left on shot clock
- Fourth is unknown.
- The tracking data. This itself is an 11x5 array.
That last element deserves a lot more attention, so let’s break that down too. Keep in mind that the first element always describes the ball, which you can tell by it -1 team id and player id.
- Team id.
- Player id.
- X-coordinate
- Y-coordinate
- Z-coordinate (only tracks ball).
Each of these tracking arrays are inside their own moment element in each array. Ideally, we’d have one big 2d array.
We can access all the moments in an event using list comprehension.
player = np.array([np.array(moment[5]) for moment in df['events'][1]['moments']])
Player is in the shape (530,11,5). This is because there are 530 moments in this event. We already know that each moment has 11 arrays so we don’t really need separate 11x5 arrays. Plus, it’ll be easier to convert into a DataFrame if it’s 2d. To get the right shape, we can set the reshape size to 530x11.
player_df = np.reshape(player,newshape=(player.shape[0]*player.shape[1],5))
player_df = pd.DataFrame(player_df)
Now, name the columns.
player_df.columns = ['TEAM_ID','PLAYER_ID','LOC_X','LOC_Y','LOC_Z']
Next are some small adjustments. Team id needs to be categorical instead of a float. I added 1 to the z-coordinate for visualization purposes. Lastly, I introduced a column “MOMENT_NUM”.
player_df['TEAM_ID'] = pd.Categorical(player_df.TEAM_ID)

player_df['LOC_Z'] = player_df['LOC_Z']+1
player_df['MOMENT_NUM'] = np.divmod(np.arange(len(player_df)),11)[0]+1
TEAM_ID	PLAYER_ID	LOC_X	LOC_Y	LOC_Z	MOMENT_NUM
0	-1.000000e+00	-1.0	66.19088	20.37273	2.94592	1
1	1.610613e+09	2594.0	28.58620	21.64312	1.00000	1
2	1.610613e+09	200794.0	47.37216	24.03445	1.00000	1
3	1.610613e+09	201143.0	24.87104	24.38831	1.00000	1
4	1.610613e+09	201952.0	33.45193	25.15548	1.00000	1
...	...	...	...	...	...	...
5528	1.610613e+09	101141.0	88.89071	22.60676	1.00000	503
5529	1.610613e+09	202704.0	71.21138	22.01670	1.00000	503
5530	1.610613e+09	202694.0	76.23904	34.58023	1.00000	503
5531	1.610613e+09	203484.0	79.59428	10.40235	1.00000	503
5532	1.610613e+09	203083.0	84.03633	21.00720	1.00000	503
This looks good. Next time I’ll cover animating this with Plotly, converting full games to a DataFrame, merging with other useful data, and creating some useful statistics.
Keep in mind that you’ll want to handle the files a bit differently if you plan to create a function that converts an entire game into a CSV. It’s much faster to work directly with json and numpy and convert to a DataFrame as the last step instead of using Pandas functions right away.